Logs Application
Logs serve as detailed records of system events, capturing key activities and changes that occur within a platform. The Logs Application in RunMyProcess offers a comprehensive interface to view and manage these logs, enabling users to monitor system activities, track issues, and gain insights into platform performance. By accessing log entries, you can ensure system transparency and promptly address any operational concerns.
1 Overview
When events occur on the RunMyProcess platform, the system records their details in logs for future reference and analysis. The Logs Application provides a centralized tool for viewing these records, helping users track and manage platform activities efficiently. Logs are organized into seven distinct categories, allowing for streamlined monitoring and easy navigation of specific types of events.
| Log Categories | |
|---|---|
| Access Log | Records details of all login attempts to the platform, including successful and failed logons. |
| Process Log | Tracks the execution of processes, including information on their status (e.g., completed, failed, in-progress) |
| Composite API Log | Logs the execution of Composite APIs, providing details about each API call and its outcome. |
| Custom Log | Captures custom log messages added by application developers, allowing for flexible tracking of application-specific events. |
| API Call Log | Stores detailed records of API calls made on the platform, helping monitor external and internal API interactions. |
| Version Log | Tracks changes to project versions, documenting version history for easy reference and troubleshooting. |
| Instance Deletion Log | Logs information about the deletion of web interface instances and process instances, ensuring transparency in instance management. |
2 Using the Logs Application
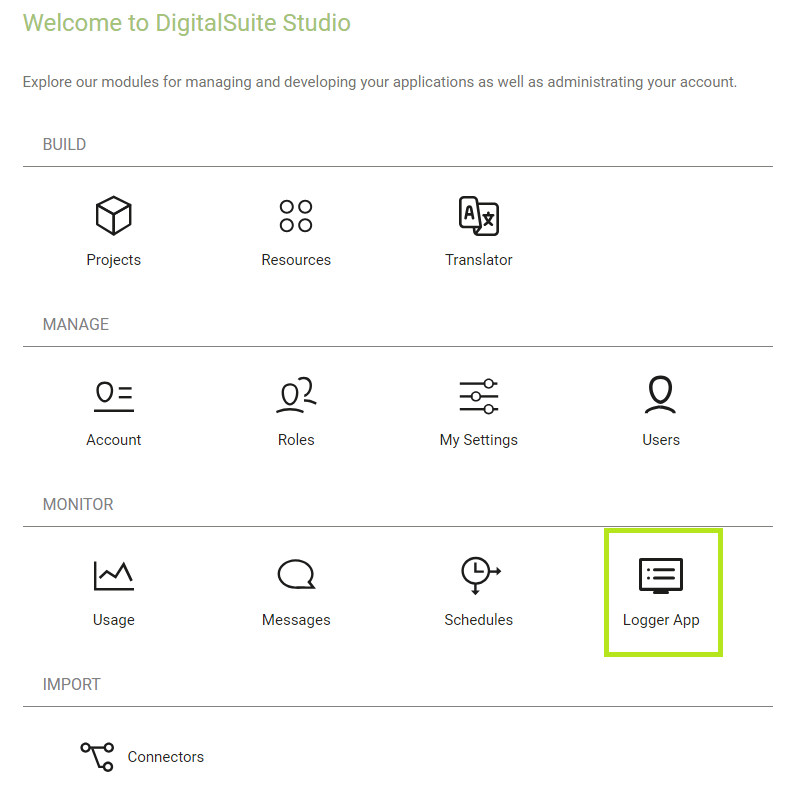
You can access the Logs Application through the MONITOR section on your RunMyProcess DIGITAL SUITE homepage.
The application’s interface is designed for ease of use, with each log category organized into separate tabs for intuitive navigation. Simply click on a tab to view the corresponding log details. This streamlined layout allows you to quickly access the specific log information you need, helping you monitor and analyze system events efficiently.

2.1 Searching
You can search for activities that occurred during a specific time frame.
You can narrow your search by selecting the environment you wish to review—Test, Acceptance, or Live. This filtering option is available for all log categories, except for the Access Log, Version Log, and Instance Deletion Log.

Remember to click the Apply button to display the search results.
2.2 Export
The Export Wizard allows you to easily transfer log data to an external file for further analysis or record-keeping. You can export logs in the following formats:
- Comma-Separated Values (CSV): Standard format with fields separated by commas.
- Tab-Separated Values (TSV): Data fields are separated by tabs.
- Semicolon-Separated Values (CSV+SEMI): Similar to CSV, but uses semicolons as the delimiter.
These flexible export options enable you to work with log data in your preferred format, ensuring compatibility with various external tools and systems.
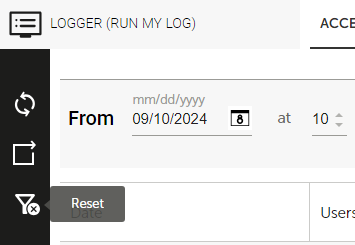
2.3 Reset filters
The Reset Filters option allows you to revert to the default settings quickly. This feature is useful when you must clear your selected search criteria and return to the original.

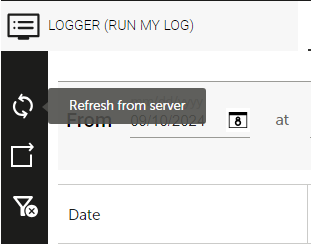
2.4 Refresh from server
The Refresh from Server feature allows you to update the log data displayed on the page by fetching the latest entries directly from the server. This ensures that you are viewing the most current log information without needing to manually reload the application, providing real-time monitoring of platform activities.

3 Log Information
3.1 Access Logs
The Access Logs tab provides detailed information about user logons to the platform and any authorization issues that have occurred. The following details are included:
- Date: The date and time when the access attempt was made.
- User: The username of the individual attempting to access the platform.
- Scheme: The authentication method used for the logon, such as HTTP Basic or OAuth.
- User Agent: Information about the platform or browser from which the access attempt originated.
- Event: Indicates whether the event was a successful logon or an authorization problem, such as an attempt to access a restricted resource.
- IP: The IP address from which the access attempt was made.

3.2 Process Logs
The Process Logs tab provides detailed information about each process instance initiated on the platform. The log includes the following details:
- Date: The date and time when the process instance concluded.
- Status: The final status of the process instance, with possible values:
- Outdated: The process instance failed to complete within the required time frame, typically due to an explicit call to P_set_request_status by the application developer.
- Canceled: The process instance was manually canceled before completion.
- Aborted: The process instance was terminated due to an error.
- Completed: The process instance was completed successfully.
- Project Name: The name of the project associated with the process instance.
- Project ID: The unique identifier of the project associated with the process instance.
- Process ID: The unique identifier of the process.
- Request ID: The unique identifier assigned to the request. This value is linked to the URL of the process instance.
- Project Version ID: The unique identifier of the project version under which the process instance ran. Note: 0 is displayed for instances running in Test mode if no project version was created.
- Parent Request ID: The unique identifier of the parent process or Composite API that triggered the process.
- Last Step: The unique identifier of the final step in the process.
- Iteration: For final steps that were loop tasks, this field indicates the number of iterations completed. If the final step was not a loop task, this field shows 0.
- Duration: The total duration, in milliseconds, that the process instance ran.
- Trigger Method: The method used to initiate the process, with possible values:
- APPLI: The process was manually launched from an application.
- LISTENER: The process was triggered automatically via a process listener.
- MESSAGE: The process was started by sending an email to the platform.
- TIMER: The process was scheduled and triggered by a timer.
- WS: The process was initiated by a Web Service, typically a connector.
- PROCESS: The process was launched by another process.

3.3 Composite API Logs
The Composite API Logs tab displays detailed information about the execution of Composite APIs on the platform. The log provides the following details:
- Date: The date and time when the Composite API execution concluded.
- Status: The final status of the Composite API, with the following possible values:
- Outdated: The Composite API failed to complete within the required time frame, typically due to a P_set_request_status call made by the application developer.
- Canceled: The Composite API was manually canceled before completion.
- Aborted: The Composite API could not be completed due to an error and was aborted.
- Completed: The Composite API successfully completed its execution.
- Project ID: The unique identifier of the project that the Composite API is part of.
- Composite API ID: The unique identifier of the Composite API.
- Request ID: The unique identifier assigned to the request that triggered the Composite API.
- Project Version ID: The unique version identifier of the project under which the Composite API ran.
- Parent Request ID: The unique identifier of the parent process or Composite API that called the current Composite API.
- Last Step: The unique identifier of the final step executed in the Composite API.
- Iteration: Indicates the number of iterations completed if the final step was a loop task. If the final step was not a loop task, this field is set to 0.
- Duration: The total duration, in milliseconds, that the Composite API ran.
- Trigger Method: Specifies how the Composite API was launched, with the following possible values:
- APPLI: Launched manually from an application.
- LISTENER: Automatically triggered via a process listener.
- MESSAGE: Triggered by sending an email to the platform.
- TIMER: Triggered by a scheduled timer event.
- WS: Launched by a Web Service (typically through a connector).
- PROCESS: Launched by another process.

3.4 API Call Logs
The API Call Logs tab provides comprehensive information on all API calls made on the platform, including direct Composite API calls, which are also available in a separate log category (refer to Composite API Logs). The log includes the following details:
- Date: The date and time when the API call was made.
- Status Code: The response status code received, is based on the protocol used for the API call.
- Project ID: The unique identifier of the project in which the API call was executed.
- Request ID: The unique identifier of the request that initiated the API call.
- Protocol: The protocol used for the API call. The platform supports the following internal protocols:
- MAIL: For an email sent from an Email-type task.
- PUSH_MESSAGE: For a push notification to a mobile device from an Email-type task.
- PUSH_NOTIFICATION: For a push notification to a mobile device from a Manual-type task.
- USER_MESSAGE: For administrative emails sent by the platform.
- NOTIFICATION: For an email sent from a Manual-type task.
- JAVASCRIPT: For a Script-type task that executes a JavaScript file.
- FREEMARKER: For a Script-type task that executes a FreeMarker template.
- DOC2PDF: For a Script-type task that generates a PDF.
- Server Host: The URL of the provider associated with the connector.
- Connector: The URL of the connector. When concatenated with the provider URL, this forms the full URL of the connector.
- Attempt No.: Indicates the number of attempts made for the API call, provided the retry option is enabled for the connector. A maximum of three attempts can be logged, with each attempt logged on a separate line.
- Call Type: Specifies whether the call was to an external service (External) or internal to the platform (Internal).
- Duration: The duration of the API call in milliseconds.

3.5 Custom Logs
The Custom Logs tab provides information about errors and other events that occur during application execution. Developers can also configure their applications to log custom information by calling the P_log FreeMarker method. This allows for flexible logging of events specific to the application's needs. The following details are provided:
- Date: The date and time when the logged event occurred.
- Log Level: The type and severity of the log entry. Possible values include:
- SEVERE: Critical errors or serious failures.
- WARNING: Potential issues that may need attention.
- INFO: General informational messages.
- CONFIG: Configuration details for the application.
- FINE: Basic tracing information.
- FINER: More detailed tracing.
- FINEST: Highly detailed tracing for debugging.
- Message: A descriptive message explaining the logged event or error.
- Login: The email address of the user who initiated the process in which the event occurred.
- Process ID/Composite API ID: The unique identifier of the process or Composite API that generated the event.
- Project ID: The unique identifier of the project associated with the event.
- Request ID: The unique identifier of the request from which the event originated.
The Custom Logs allow developers to capture both error-related and event-specific information, providing valuable insights for debugging, auditing, and tracking the application's behavior.

3.6 Version Logs
The Version Logs tab provides detailed version history information for all projects on the platform. This tab helps track the versioning changes and updates made to projects. The following information is displayed:
- Date: The date and time when the current execution mode was set.
- User: The email address of the user who changed the execution mode.
- Project ID: The unique identifier of the project to which the version belongs.
- Version ID: The unique identifier of the specific project version.
- Updated Mode: The execution mode to which the version was changed. Possible values include:
- TO_LIVE: The version was set to live mode.
- TO_ACCEPTANCE: The version was set to acceptance mode for testing and validation.
- TO_TEST: The version was set to test mode for development or internal testing.
- Version Title: The name or title of the version.
- Previous Mode: The execution mode from which the version was changed. Possible values include:
- LIVE: The version was previously live.
- ACCEPTANCE: The version was previously in acceptance mode.
- TEST: The version was previously in test mode.
- N/A: Displayed for versions created before the versioning feature was introduced.

3.7 Deleted Instance Logs
The Deleted Instance Logs tab provides detailed information about deletion operations performed on web interface and process instances within the platform. The following data is available for each deletion event:
- Date: The date and time when the instance was deleted.
- User: The email address of the user who executed the deletion.
- Instance ID: The unique identifier of the deleted instance.
- Type: The type of deletion performed. Possible values include:
- APP_DELETION: For the deletion of a web interface instance.
- PROCESS_DELETION: For the deletion of a process instance.
- IP: The IP addresses of both the client and proxy servers involved in the deletion.
- Title: The name of the web interface or process instance that was deleted.
- State: Provides a reference number and the name of the web interface screen, along with the status of the deleted web interface instance (e.g. Ref = 1, Title = Launch). Possible status values are:
- CREATED (0): The request has not yet been triggered.
- START (1): The request is pending.
- END (2): The request was completed successfully.
- CANCEL (3): The request was manually canceled by a user.
- OUTDATED (4): The request failed to complete in the required time frame.
- Status: The status of the deleted process instance. Possible values are: NONE (0): The process is queued but has not yet started. READY (100): The process has started its first step. ACTIVE (101): The process is currently running. WAITING (102): The process is waiting for an external action (e.g., a manual task). WAITING_RESUME (103): The process is waiting to be resumed. COMPLETED (201): The process was completed successfully. ABORTED (301): The process was aborted due to an error. KILLED (302): The process was stopped by the platform. CANCELLED (400): The process was canceled by a user. OUTDATED (401): The process failed to be completed within the required time frame.
- User Agent: Details on the browser used to initiate the request.
- Reason: Only relevant for process instances, this field explains the reason why the instance was deleted.

4 Logs Retention Policy
The RunMyProcess Logs Retention Policy ensures that logs are maintained and accessible for a defined period. Logs on the platform are retained for the current year and the previous year. This means that any log entries older than two years are automatically purged from the system, ensuring efficient data storage and management.
Administrators are advised to regularly review and export necessary logs within this retention period to maintain records for auditing or troubleshooting purposes beyond the available timeframe.